Spreadsheet Financial Analysis: How to Check Your Figures
24% of the 15,770 spreadsheets recovered from the Enron email archive contained errors, and the worst single file held 83,273 of them, according to written evidence submitted to the UK Parliament. The same evidence shows why one bad cell travels so far: 59% of the erroneous formulas fed at least one dependent cell, and each erroneous cell had an average of 9.6 formulas resting on it.
That's a provenance problem, not an arithmetic problem. Almost nobody who builds a financial model gets stuck on a SUMIF. They get stuck when a number that looked right in October can't be reproduced in February, because the price was a typed constant, the volume sat in a tab nobody owned, and the person who checked it has moved to another team.
The fix is to treat the workbook as an evidence chain. Every headline figure needs a source document, a formula path another analyst can walk, and a named reviewer. The checks below are the ones that hold that chain together.
Table of Contents
- Five Steps to Analyze a Financial Spreadsheet
- Stress Tests That Expose Broken Formulas
- Choosing Between Sensitivity and Scenario Analysis
- Checking Figures Against Source Documents
- Key Indicators to Summarize for Decision Makers
- Confirm the Workbook and Protect the Data
Five Steps to Analyze a Financial Spreadsheet
Operational workbooks aren't clean by default, and audits of them keep finding errors in most of the files examined. That's the reason to build the workflow around traceability rather than formatting. The sequencing rule is old and still correct: separate inputs, calculations, outputs and control checks before a single formula is written, as the model design chapter in the Wiley finance series sets out.
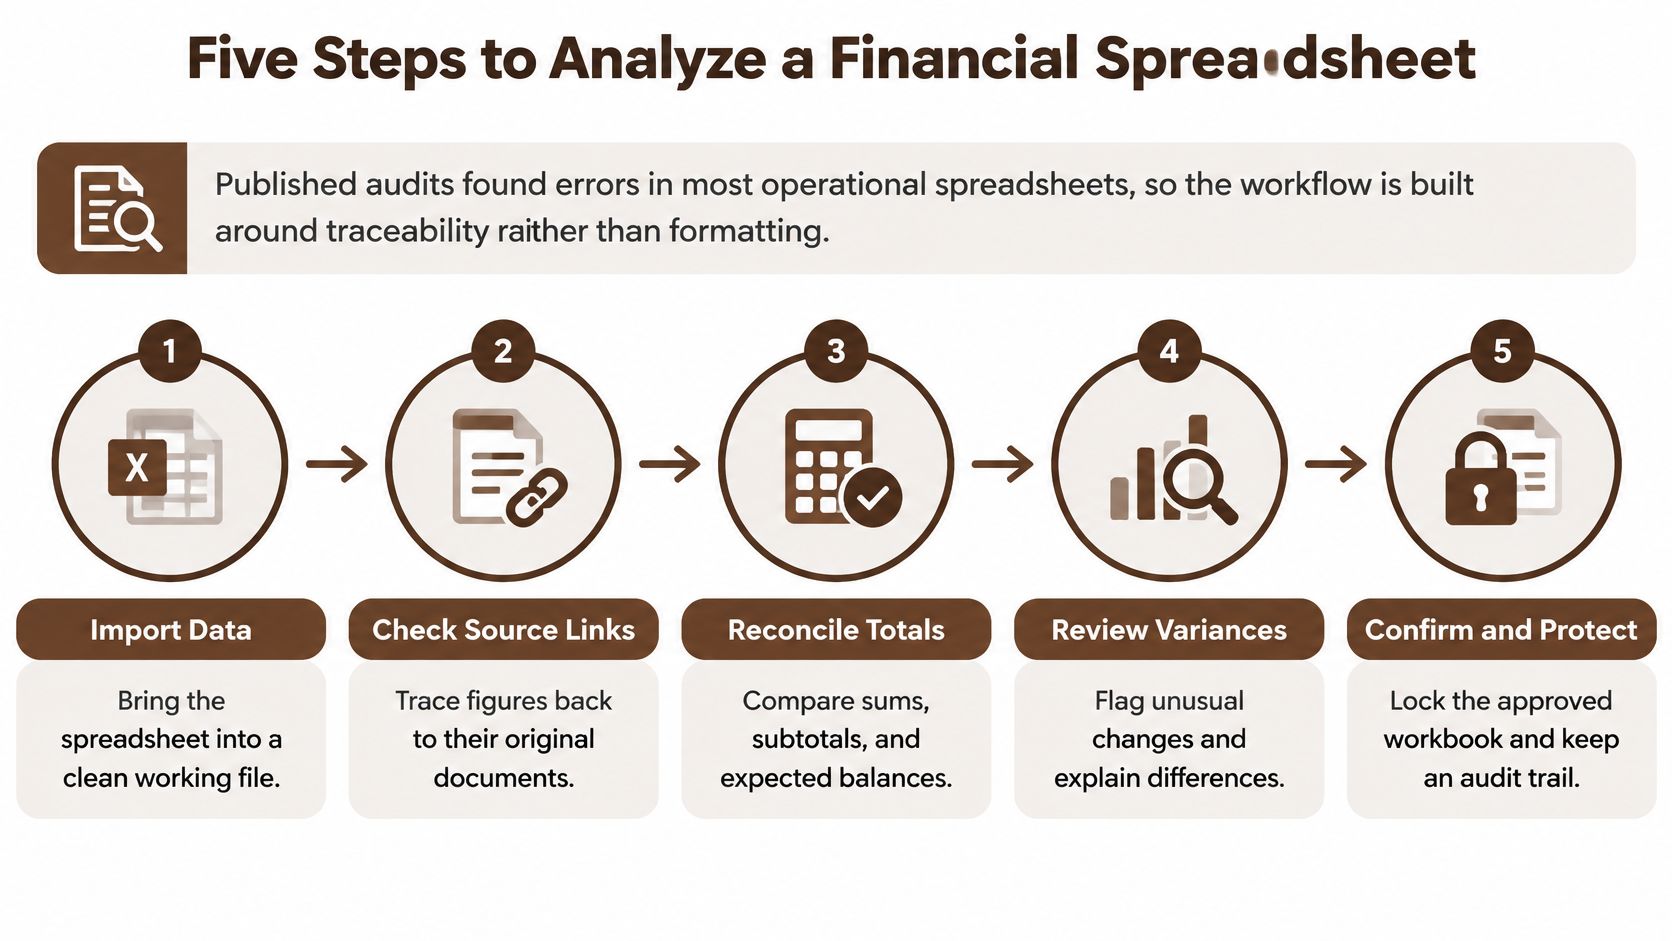
Five steps, in the order that keeps the trail intact.
Define the purpose, period and outputs first. Write down the reporting period, the currency, the units (thousands, millions, whole units) and the exact outputs the file must produce, whether that's a 13-week cash forecast, a valuation summary or a covenant test. Every layout decision after this follows from that list. The common slip: a workbook that has acquired three purposes and now produces two versions of EBITDA because nobody agreed which one goes to the board.
Put every assumption in one place. One assumptions sheet, one row per input, each labelled with its unit and the person who owns it. Keep typed numbers out of formulas. A constant buried inside a formula is invisible during review, and when the price changes the total stays wrong without announcing itself. The common slip: someone patches a figure inside a formula at 11pm before a deadline and never copies it back to the assumption sheet.
Build calculations from operational drivers. Volume, price, headcount, working capital days, tax rates. Each output should trace back to a driver rather than to another output. Drivers are what management can argue with, and a forecast built on last year's percentages gives them nothing to argue about. If the model feeds a credit decision, start from a driver set that has already been tested: the CFO guide to underwriting client credit lists the inputs a lending decision needs. The common slip: revenue entered as a growth rate applied to a prior total, which nobody can verify because no single volume or price sits behind it.
Reconcile outputs to accounting totals. Ledger revenue, bank cash, the balance sheet check to zero. Reconciliation is the only test that uses numbers you didn't produce yourself. The common slip: reconciling once at the start and never again, so a late adjustment leaves the final file differing from the reconciled version by an amount nobody can name.
Stress-test before anyone reads the results. Zero, doubling and sign-reversal changes, run on a copy of the file. Testing after the pack has circulated means the correction has to be explained in public. The common slip: testing on the live workbook without recording base case values, so there's no way back to the version that was right.
What a Finished Workbook Looks Like
One source for every assumption. One formula path for every headline figure. A reconciliation line that shows a zero difference and the date it was last proved. Those three things make a workbook reviewable by someone who didn't build it.
Mathematically correct and controllable are different states. The first gets you a number. The second gets you a number you can defend in a room full of people paid to disagree with you. Every serious piece of spreadsheet financial analysis lives or dies on that difference.
Stress Tests That Expose Broken Formulas
A stress test changes one input and checks that the output moves the way the business logic says it must. Four single-input changes catch most of the failures I come across.
| Test | Change made | Expected result | Red flag |
|---|---|---|---|
| Zero price | Set the price driver to zero | Revenue falls to zero | Revenue still shows a value |
| Doubled units | Double the unit volume | Revenue roughly doubles | Revenue unchanged or moves by another factor |
| Zero indexation | Set the indexation rate to zero | Indexed costs stop rising | Indexed costs keep growing |
| Reversed cost sign | Flip the sign of a cost input | Cost and profit move in opposite directions | Profit does not move at all |
Each test interrogates a different mechanism. Zero price hunts for a typed price or a revenue line pointing at a hard-coded total. Doubling catches formulas that add where they should multiply, which happens constantly in anything built by dragging a row sideways. Zero indexation exposes escalation applied at a fixed rate or an index linked to the wrong cell. Reversing a sign catches stale references, because a cost pulled from last month's copy of a tab will ignore your change entirely.
Two Worked Cases
Say a subscription business sets price to zero and revenue falls by only 8%. Something is still feeding that line. It's usually one of two things: a price typed into the formula as a literal, or a revenue row that points at a companion tab where the price was hard-coded a year ago and never linked to the assumptions sheet.
Now reverse the sign on a cost input and watch profit. If profit doesn't move at all, the P&L isn't reading the input you changed. The cost is arriving from a stale cell, a second copy of the assumptions, or a subtotal that was pasted in as values.
Before you touch anything: copy the workbook, write the base case value of each of the five main outputs into a notes tab, and run every test on the copy.
Property models show the doubling test at its most useful. In spreadsheet rental property analysis a rent roll normally multiplies units by rent by occupancy, so doubling units should double gross rent. If rent climbs by less than that, one of the three inputs is typed rather than driven.
If an output doesn't respond to its driver in the expected direction, trace the formula path before you trust anything built on it. A number that survives a zero test is a guess with formatting.
Choosing Between Sensitivity and Scenario Analysis
Sensitivity analysis moves one or two drivers to see how far an output travels. Scenario analysis moves several linked assumptions at once so each case stays internally consistent.
| Method | Inputs varied | Excel tool | Best for |
|---|---|---|---|
| One-variable sensitivity | One driver | One-variable data table | How far one price or volume change moves the output |
| Two-variable sensitivity | Two drivers | Two-variable data table | Grids of price against volume |
| Scenario analysis | Several linked assumptions | Scenario switch and assumption block | Base, upside and downside cases |
Say a manufacturer wants to know what a 10% rise in material cost does to gross margin. That's a sensitivity: one driver, one output, one answer, and a one-variable data table returns it in about four minutes.
The question changes shape when material costs rise, volume falls and customers take longer to pay at the same time. Those three are linked, since slower collections follow weaker volume and both change the cash requirement. Moving them one at a time produces results that can't happen together in the same year.
Data tables also have a hard ceiling: one output and up to two input variables. Anything wider needs a scenario switch cell that selects an assumption block, using CHOOSE or INDEX against a scenario number, so the whole model reads one consistent set of inputs. Then three criteria decide the method.
- How many drivers move together. One or two, use a data table. Three or more that are causally linked, use a scenario.
- Whether the reader wants a number or a range. A single figure suits a data table. A set of coherent cases suits scenarios.
- Who receives the output. A lender or a board will ask which assumptions produced the case, and a scenario you can switch and regenerate is easier to defend than a printed grid nobody can rebuild.
Run sensitivity first to find which drivers move the answer, then build scenarios only around those. Scenarios built around drivers that barely matter are decoration.
Checking Figures Against Source Documents
Checking starts where the workbook meets its documents. A peer-reviewed audit of 50 operational spreadsheets found errors in 47 of them, and traced roughly 30% to 40% of those errors to numbers typed directly inside formulas. Across 270,722 formulas the average error rate was 0.87% under the restrictive definition and 1.79% under the broader one. A low rate per cell still puts material error into a workbook with thousands of cells.
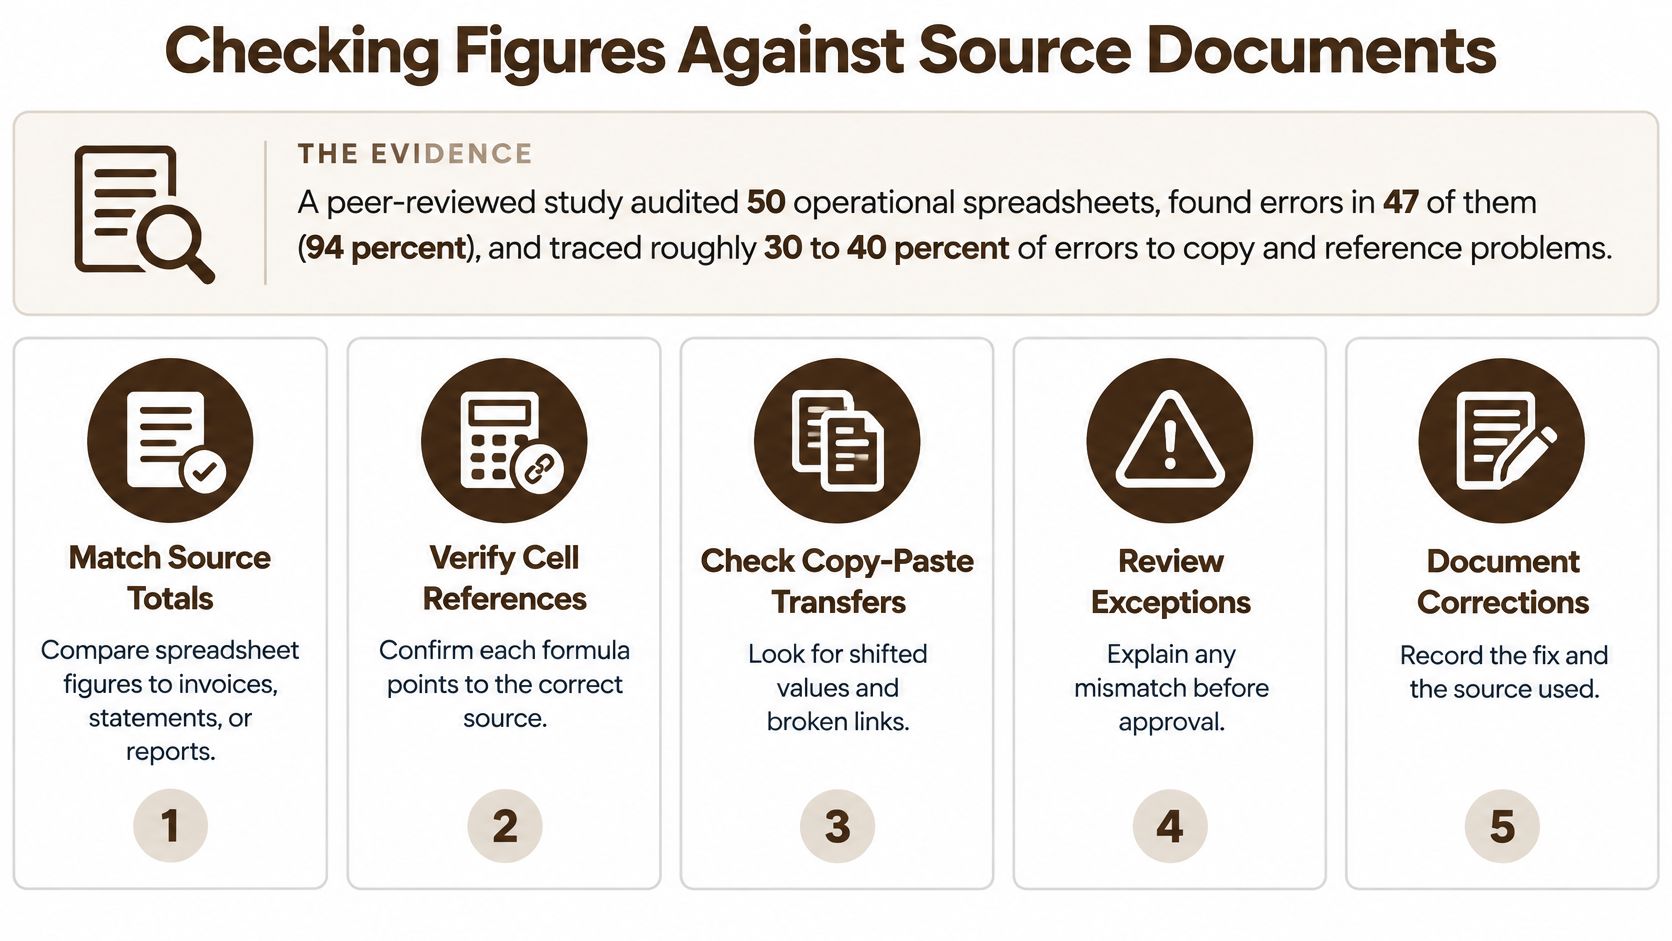
Five checks, each against a named document rather than against the workbook's own logic.
- Tie totals to source documents. Revenue, cost of sales, receivables and cash, matched to PDF invoices, bank statements and the ledger extract that feeds them. Anything you can't match goes on a list, not through the review.
- Test contract terms against the assumptions sheet. Payment days, early-settlement discounts, escalation clauses, minimum volumes. A contract that allows 60 days when the model uses 45 overstates the cash position for two months.
- Read the documents and the workbook side by side. DOCX contracts, PDF agreements and XLSX source reports against the rows they feed, with a written list of unmatched lines. Our document analysis accepts PDF, DOCX and XLSX files dropped in together and answers from all of them at once, which is how a payment spreadsheet gets compared with the contracts behind it. The reviewer still signs off every difference.
- Recalculate the three largest outputs independently. A second file or a calculator. If your profit figure only exists inside the model, you have a formula, not a figure.
- Log the source, date and reviewer for every reconciled total. One row per total. This is the step everyone skips and the one that makes the next review faster.
Bank and intercompany tie-outs have a recognisable shape, and these worked reconciliation examples from Loopfour show what a complete one looks like before you rebuild your own. On the payables side, invoice processing is where many workbook errors enter, because extracted fields land in a tab before anyone compares them with the document.
Where Typed Numbers Hide
The built-in tools find most of it.
| Tool | Where to find it | What it reveals |
|---|---|---|
| Trace Precedents | Formulas tab, Formula Auditing group | Every cell feeding a headline figure |
| Go To Special, Constants | Home tab, Find and Select | Typed numbers sitting outside the assumptions sheet |
| Evaluate Formula | Formulas tab, Formula Auditing group | The step-by-step result of a broken calculation |
| ISFORMULA | Formula bar, type =ISFORMULA(cell) | Whether an output cell holds a formula or a typed value |
Run Go To Special, Constants on every imported tab. That single step finds more hard-coded values than a full day of reading formulas by eye.
Key Indicators to Summarize for Decision Makers
Profit is positive. Operating cash flow is negative. Both can be true in the same month, and a summary that shows only the first one misleads the person who has to decide. Six indicators cover most of what a management or lender summary needs.
| Indicator | Formula | What it tells the reader |
|---|---|---|
| Gross margin | Revenue minus cost of sales, divided by revenue | Pricing power and direct cost control |
| EBITDA margin | EBITDA divided by revenue | Operating profitability before financing and depreciation |
| Operating cash flow | Cash from operations in the cash flow statement | Whether reported profit turns into cash |
| Current ratio | Current assets divided by current liabilities | Short-term liquidity |
| Net debt to EBITDA | Debt minus cash, divided by EBITDA | Leverage and repayment capacity |
| Days sales outstanding | Receivables divided by revenue, times days in period | How quickly customers pay |
In the example above, gross margin looks healthy and operating cash flow is negative because receivables grew faster than sales. Put both lines next to each other and the reader reaches the right conclusion without being told what to think.
Figure, Prior Period, Change, Footnote
Three of those words are mechanical. The fourth is where summaries lose credibility.
Every figure gets the current period, the comparison period and the change. Any figure that depends on a typed assumption gets a footnote naming the assumption and its owner. Any ratio whose denominator you haven't reconciled to the ledger stays out of the pack.
Decision-level error is a different risk from cell-level error. In one cited audit of two spreadsheets used to propose major development plans, both contained errors and one produced a result that was 16% wrong, as recorded in this catalogue of spreadsheet audit findings. The second error was smaller. Both spreadsheets carried decisions far larger than the defect that caused them.
A workbook can be right in almost every cell and still send a board the wrong way, because the two cells that were wrong were the ones feeding the loan covenant.
Design matters too, though it's the cheaper problem. A monthly pack that gets read keeps the same layout every month and labels its exceptions, which is the ground covered by this guide to monthly KPI dashboards. The traceability discipline travels well beyond the finance pack. Spreadsheet stock analysis fails in exactly the same place: the ratios are simple, and keeping every input tied to a dated source is the actual work.
Confirm the Workbook and Protect the Data
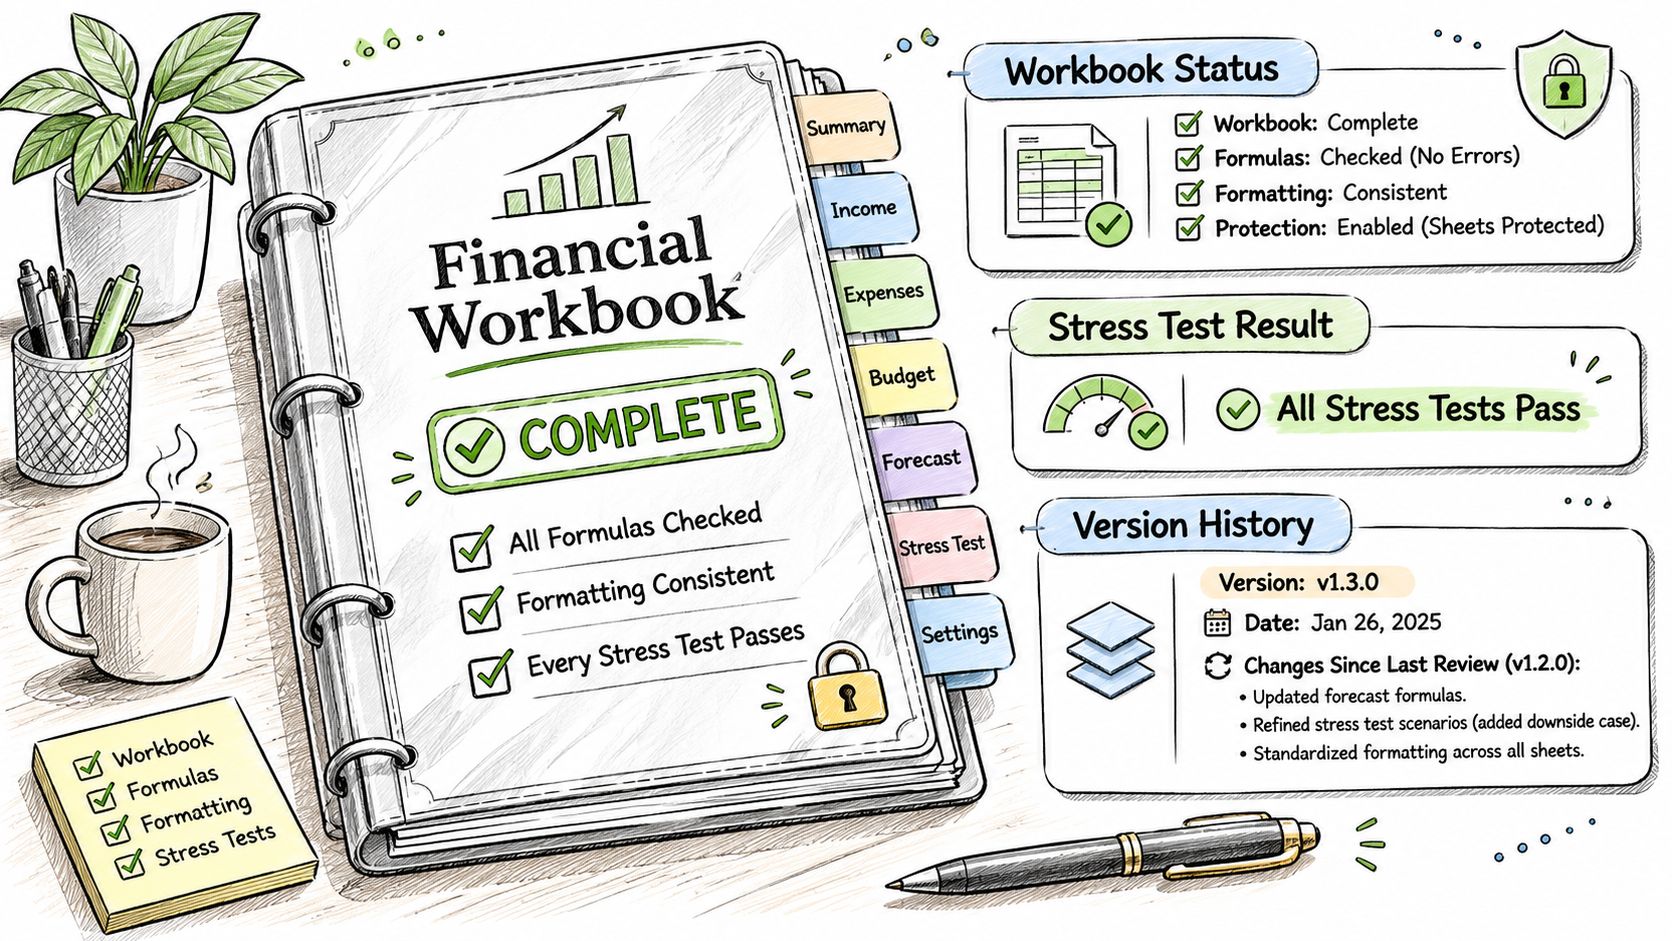
A workbook is ready when four things are true: every assumption has a source, every headline figure has a formula path, the reconciliation line shows zero, and every stress test passes. Add a version note recording the date, what changed since the last review, and who approved it. Without that note, the next reviewer can't tell a correction from a rewrite.
Then the data rule. The European Data Protection Board's guidance for small organisations says personal data should be stored only for the period its purpose requires, then deleted or anonymised, while national law may require longer retention for duties such as taxation. A workbook holding names, bank details, employee records, customer records or invoice identifiers is personal data if it was uploaded for analysis. Write the retention policy before the file leaves your team: why it's processed, how long it stays, which legal duty applies, and how deletion is carried out.
Replace identifiers with codes before a shared review. Archive only the version that passes every check, then run the five steps, the stress tests and the reconciliation again on the next workbook.
BromeAI handles the part of this that eats the most time: drop the XLSX workbook, the signed PDF contract and the DOCX terms into one case, and the document analysis reads all of them together and answers with the lines it used. With agentic AI you describe the outcome you want, Brome breaks it into tasks you can see before anything runs, and it reports back with sources once every task is done. Take the workbook that keeps coming back from review with the same questions and put it through BromeAI before the next pack goes out.