Spreadsheet Rental Property Analysis: How to Build One
Average monthly insurance costs for multifamily properties rose by more than 75% between 2019 and 2024, and insurance costs grew nearly three times faster than total operating costs from 2023 to 2024, according to the PRRAC journal's account of rental market distress. In most rental workbooks, that line sits in row 40, filled once from a quote taken before the offer and never touched again.
A spreadsheet rental property analysis that treats insurance as a constant is answering a question nobody asked. The clean 8% yield on the listing survives only until vacancy, a repriced policy and the split between taxable income and cash flow get their own rows. Some deals come out of that process intact. More come out smaller, and a few come out negative.
Table of Contents
- The Formulas Behind Every Rental Analysis
- How to Build the Input Sheet Step by Step
- Sorting Expenses Into Repairs, Improvements and Reserves
- Separating Cash Flow From Taxable Income
- Stress Testing Cash Flow Against Insurance and Vacancy Shocks
- Audit Errors Before You Trust the Numbers
- Confirm the Numbers Before You Make an Offer
The Formulas Behind Every Rental Analysis
Gross rental yield is annual rent divided by purchase price, before vacancy, operating costs, financing and taxes. On a $300,000 purchase with $24,000 of scheduled rent, the yield is 8.0%. It's the first number in the model and the least informative one, because it assumes a property occupied every day of the year, self-maintaining, and owned free of debt.
Location destroys any single benchmark. Reported gross yields ranged from about 4.42% across a tracked set of 394 metropolitan areas to 11.6% in Cleveland, with Indianapolis at about 8.2%, and the same compilation cites a national rental vacancy rate of 7.3%, per the rental property statistics compilation. A workbook that applies one national number to a specific address is guessing twice, once on the city and once on the block.
| Metric | Formula | Worked example |
|---|---|---|
| Gross rental yield | Annual rent divided by purchase price | $24,000 / $300,000 = 8.0% |
| Vacancy loss | Scheduled rent times vacancy rate | $24,000 times 7.6% = $1,824 |
| Effective gross income | Scheduled rent minus vacancy loss | $24,000 minus $1,824 = $22,176 |
| Net operating income | Effective gross income minus operating expenses | Not final until the operating expense block is filled |
| Cap rate | NOI divided by total acquisition cost | Divide by price plus closing costs plus renovation, not the listing price alone |
| Debt service coverage ratio | NOI divided by annual debt service | Report it as a multiple, the way the lender quotes it |
| Cash-on-cash return | Annual pre-tax cash flow divided by cash invested | Cash invested includes down payment, closing costs and rent-ready repairs |
Vacancy comes second because advertised rent isn't collected rent. Model it at 7.6%, a touch above the national figure, and the $24,000 loses $1,824 before a repair bill arrives. Effective gross income lands at $22,176, and every expense after that line is measured against the smaller number.
Net operating income takes over from there. Subtract management, insurance, property tax, maintenance, utilities and replacement reserves, then divide NOI by total acquisition cost for the cap rate and by annual loan payments for coverage. Cash-on-cash comes last, on the cash you really put in, not the purchase price. If you want a worked reference for which expense lines sit above NOI and which sit below it, calculating NOI on rental investments walks the operating statement line by line.
The audit test: if you can't trace an output cell back to the input that drives it in two clicks, you can't defend that number to a lender, a partner or yourself.
Build the sheet in calculation order so each row feeds the next. A metric that can't be traced can't be audited, and an unauditable model is a story with formatting.
How to Build the Input Sheet Step by Step
Build from the top down in one pass and the structure does half the auditing for you. Each block feeds the one below it, so a broken link shows up as a strange output instead of a silent error.
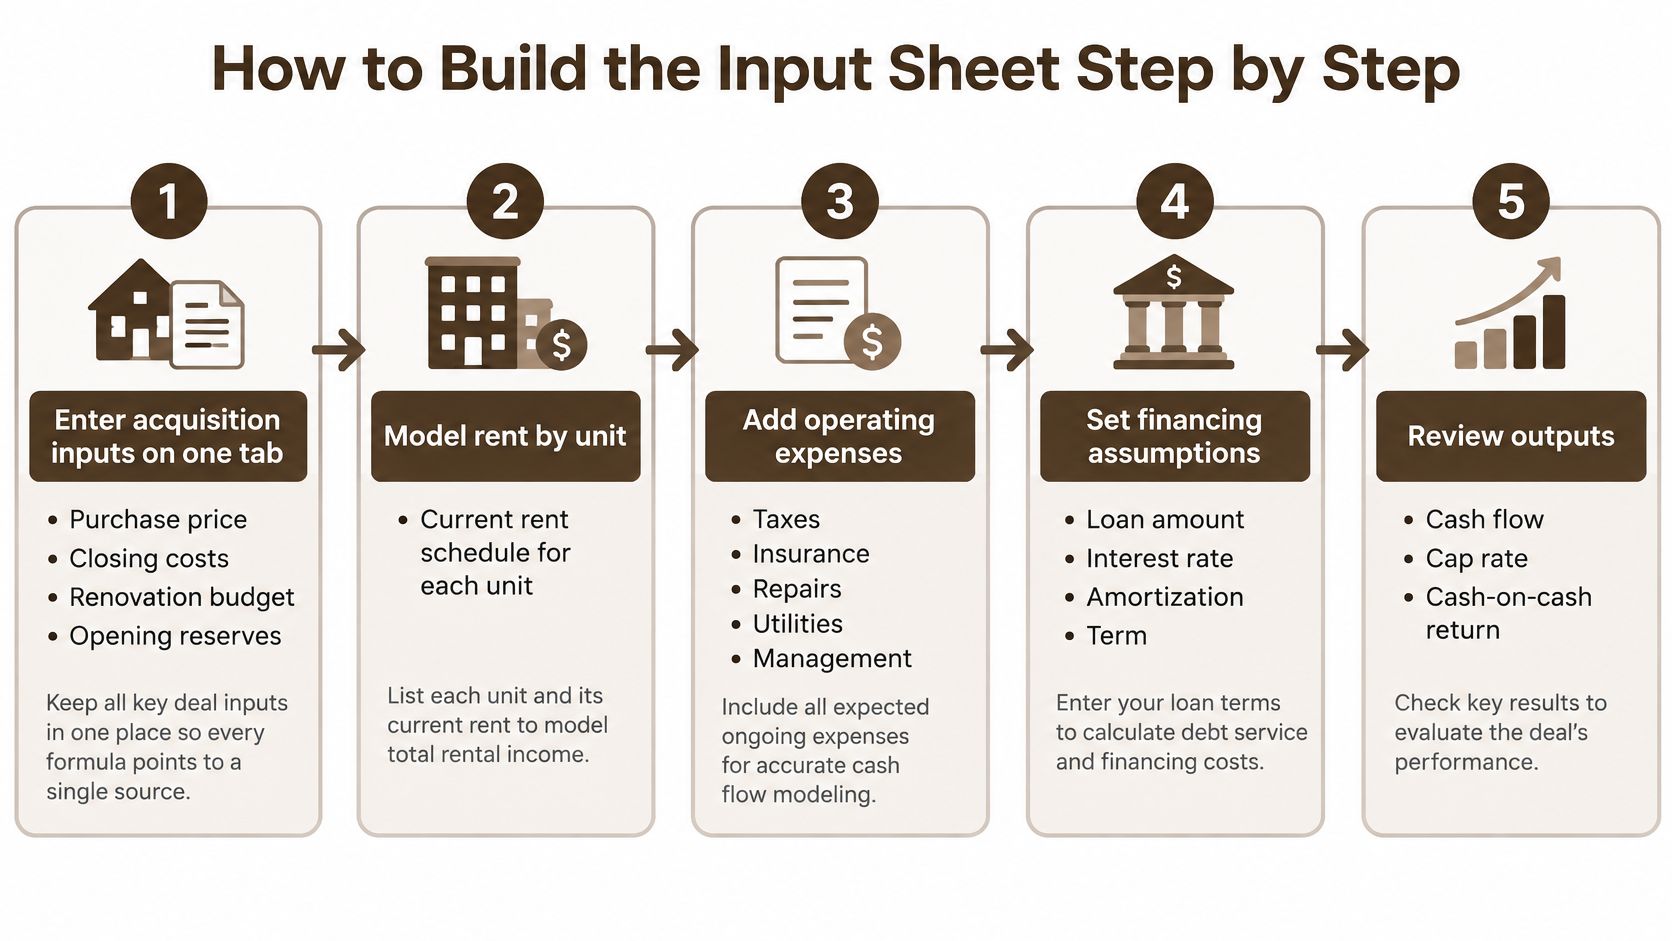
1. Put acquisition inputs on one tab. Purchase price, closing costs, renovation budget and opening reserves all live in one block, so there's a single place to correct when the closing statement lands different from the estimate.
2. Model rent by unit, with two columns. Current rent sits next to market rent. As a national reference, average monthly rents for professionally managed U.S. rental units reached $1,830 in the first quarter of 2025, 32% higher than in the first quarter of 2019, according to the Harvard Joint Center for Housing Studies. Local comparables set the number you type, because the national figure includes markets where landlords have no pricing power at all.
3. Give vacancy and collection loss their own input. Never bury it inside the rent line and never leave it at zero. When the year ends short, you want the row that explains why.
4. Push operating expenses to NOI with reserves on a separate line. Replacement reserves hidden inside repairs flatter NOI and hide real cash leaving the account. Keep three lines, not one, as that rent roll template that tracks rental income by unit makes obvious the moment you have more than one door to manage.
5. Build a monthly loan schedule. Interest and principal separate, twelve rows that sum to the annual total. The tax forecast needs the interest split and the cash flow needs the whole payment.
6. Add a sensitivity block wired to the same outputs. Rent, vacancy, expenses and interest rate each get a copy of the key cells. If retyping is involved, the scenario testing won't happen.
7. Close with an exit tab. Sale price, selling costs, remaining loan balance and depreciated basis. The exit assumption is the one most workbooks leave out entirely, which makes the returns look cleaner than they are.
Reading the Rent Line Before You Type It
Look up your market roughly, then look at the market price for that specific size, condition and neighbourhood, and you'll often find the gap between the two is the whole deal. If a place rents for materially less than the market rate, the position is already improving. If it's renting at the market rate with a tenant who pays on time, the renovation you're planning won't move the cash unless you decide the property needs it.
The gap tells you when a renewal should be repriced and when a unit is worth leaving vacant for improvements. A twelve-month lease at a rent below the market rate is a cost, and you should list it as one. A three-month vacancy to get it to market is also a cost. Decide between them on purpose, and record both numbers in the sheet so the arithmetic is in front of you when the tenant calls.
Change one input when the tab is finished, for example vacancy, and confirm that every dependent output moves in the direction you expect. Any output that ignores the change has a formula problem, not a formatting problem.
Sorting Expenses Into Repairs, Improvements and Reserves
Combining every property cost into one percentage of rent is the fastest way to make a weak deal look average. It hides the difference between a $180 service call and a full roof replacement, and those two items land in different places on the tax return and in different years on the cash flow statement.
IRS guidance holds that replacements of major components or substantial structural parts of a residential rental building are generally capital improvements, per the IRS depreciation guidance for rentals. Each one becomes a separate asset with its own placed-in-service date, generally depreciated over 27.5 years on a straight-line basis with the mid-month convention. Painting on its own is generally a currently deductible repair, as long as it isn't folded into a larger improvement project.
| Spending item | Sheet line | Tax treatment | Cash flow effect |
|---|---|---|---|
| Routine service call | Operating expenses | Currently deductible repair | Reduces NOI and cash flow in the year paid |
| Painting alone | Repairs and maintenance | Generally deductible repair | Reduces NOI and cash flow in the year paid |
| Roof replacement | Capital improvement schedule | Depreciated over 27.5 years | Cash out in the year paid, deducted over time |
| Property insurance | Operating expenses | Generally deductible | Reduces NOI and cash flow |
| Mortgage principal | Debt service only | Not a current deduction | Reduces cash flow, not NOI |
| Replacement reserve | Reserve line | Follows how the money is later spent | Reduces monthly cash flow |
Three lines prevent most of the damage. A capital improvement schedule with placed-in-service date, cost basis and remaining depreciation. A reserve line funded monthly at a realistic replacement cost, not at whatever is left over. A debt service block that keeps principal out of the operating section entirely.
Property insurance, property tax, management fees and utilities belong in operating expenses and reduce NOI. Mortgage principal never does. Money set aside for reserves reduces cash flow every month, and its tax effect follows what the money eventually buys, so the reserve line should stay visible rather than being netted into repairs. Where the workbook has to reconcile with a bookkeeper's ledger at year end, QuickBooks bookkeeping for small business is the reference most accountants will want the chart of accounts mapped against, and matching category names at the start saves a week of reclassification later.
Keep the tax forecast on its own tab. Every time you blend it into the cash flow tab, someone reads a paper deduction as available money and spends it.
Once the acquisition closes and the workbook shifts from analysis to reporting, generating a report from those same rows keeps the lender, the partner and the tax preparer looking at one set of numbers.
Separating Cash Flow From Taxable Income
Taxable income and cash flow answer different questions, and blending them is the most expensive spreadsheet error in rental work. Taxable income is rent minus operating expenses, loan interest and depreciation. Cash flow is rent minus operating expenses, the full loan payment including principal, capital spending and reserves.
IRS Publication 527 treats depreciation as recovery of the cost of income-producing property. It's a deduction with no money leaving your account. Principal repayment is money leaving your account with no deduction. Those two facts pull the same property in opposite directions.
Two Ledgers, One Property
Take a property with $12,600 of NOI, $5,500 of interest sitting inside a $9,000 annual loan payment, and $250,000 of depreciable building basis. Applying the recovery period the tax rules set for residential rentals gives roughly $9,091 of annual depreciation.
- Taxable income: $12,600 minus $5,500 minus $9,091 = negative $1,991
- Cash flow after the full loan payment and $1,000 of reserves: $2,600
Same building, same twelve months, a paper loss and a real deposit. Both figures are correct, and a workbook that produces only one of them is unusable for decisions.
Two rules keep them straight. Land is never depreciated, so the acquisition tab needs a separate land value input and the depreciation formula must run on the building portion only. And depreciation reduces adjusted basis, which raises the taxable gain when the property sells, so the exit tab has to calculate gain against the depreciated basis rather than price minus price. Buy for $400,000, depreciate $100,000, sell for $450,000, and the taxable gain starts from $300,000 of basis, not $400,000.
A deal that looks cash-strong and tax-weak on paper can flip on sale. Model the exit before you fall for the year-one number.
Stress Testing Cash Flow Against Insurance and Vacancy Shocks
Start from a property that looks fine. $24,000 of scheduled rent, $7,200 of operating expenses excluding insurance, $9,000 of annual loan payments, 5% vacancy and a $3,000 insurance premium. NOI comes to $12,600 and coverage sits at 1.40, a number any lender accepts without a second look.
Now run the same building twice more with nothing changed except vacancy and insurance.
| Scenario | Vacancy and insurance assumption |
|---|---|
| Base case | 5% vacancy, $3,000 insurance, coverage 1.40, break-even rent $20,211 |
| Stress case | 10% vacancy, $3,750 insurance, coverage 1.18, break-even rent $22,167 |
| Severe case | 15% vacancy, $6,000 insurance, coverage 0.80, break-even rent $26,118 |
The stress case cuts NOI to $10,650 and coverage to 1.18, a margin thin enough that many lenders will ask what changed. The severe case leaves $7,200 of NOI against $9,000 of debt service. Coverage of 0.80 means the property cannot pay its own loan from operations, and the $1,800 shortfall comes out of reserves every year it persists.
Reading the Coverage Ratio Under Pressure
Break-even scheduled rent is the number to stare at. It's $20,211 in the base case, $22,167 under stress and $26,118 in the severe case, so the worst case needs roughly $2,100 more rent than the $24,000 currently scheduled before the loan is covered at all. That gap is the negotiation. You either buy at a price that clears it or you accept that you're funding the property from elsewhere.
Insurance is often the fastest-moving line, which is why it deserves more than one cell. Model repricing by hazard zone rather than by national average. Add a separate line for the deductible the owner pays after a loss, because a $10,000 deductible on a wind claim is a cash event, not a rounding error. Flag any policy with renewal risk, since a quote that disappears at renewal removes income the base case assumed.
A property doesn't need a rent collapse to fail. One renewal quote can do it.
Then extend the shock to the rest of the operation. Post-disaster vacancy runs longer than ordinary turnover. Temporary repairs land in the same quarter as the deductible. Financing can stall while a claim is open. Rent restrictions may cap what you can recover. Include pass-through lines for costs you can bill to tenants and keep owner-absorbed costs separate, so a premium rise on a triple-net lease doesn't get modelled like a premium rise on a gross lease.
The contrarian result is uncomfortable: a property with an attractive historical cap rate can carry poor forward returns if insurance, not rent growth, is the dominant risk. Report break-even rent, minimum coverage and required reserves for each case instead of one annual forecast. A single projection flatters every deal.
Audit Errors Before You Trust the Numbers
Run this audit on the finished workbook, not while building it. Each item is a symptom to test, and each has a specific formula fix.
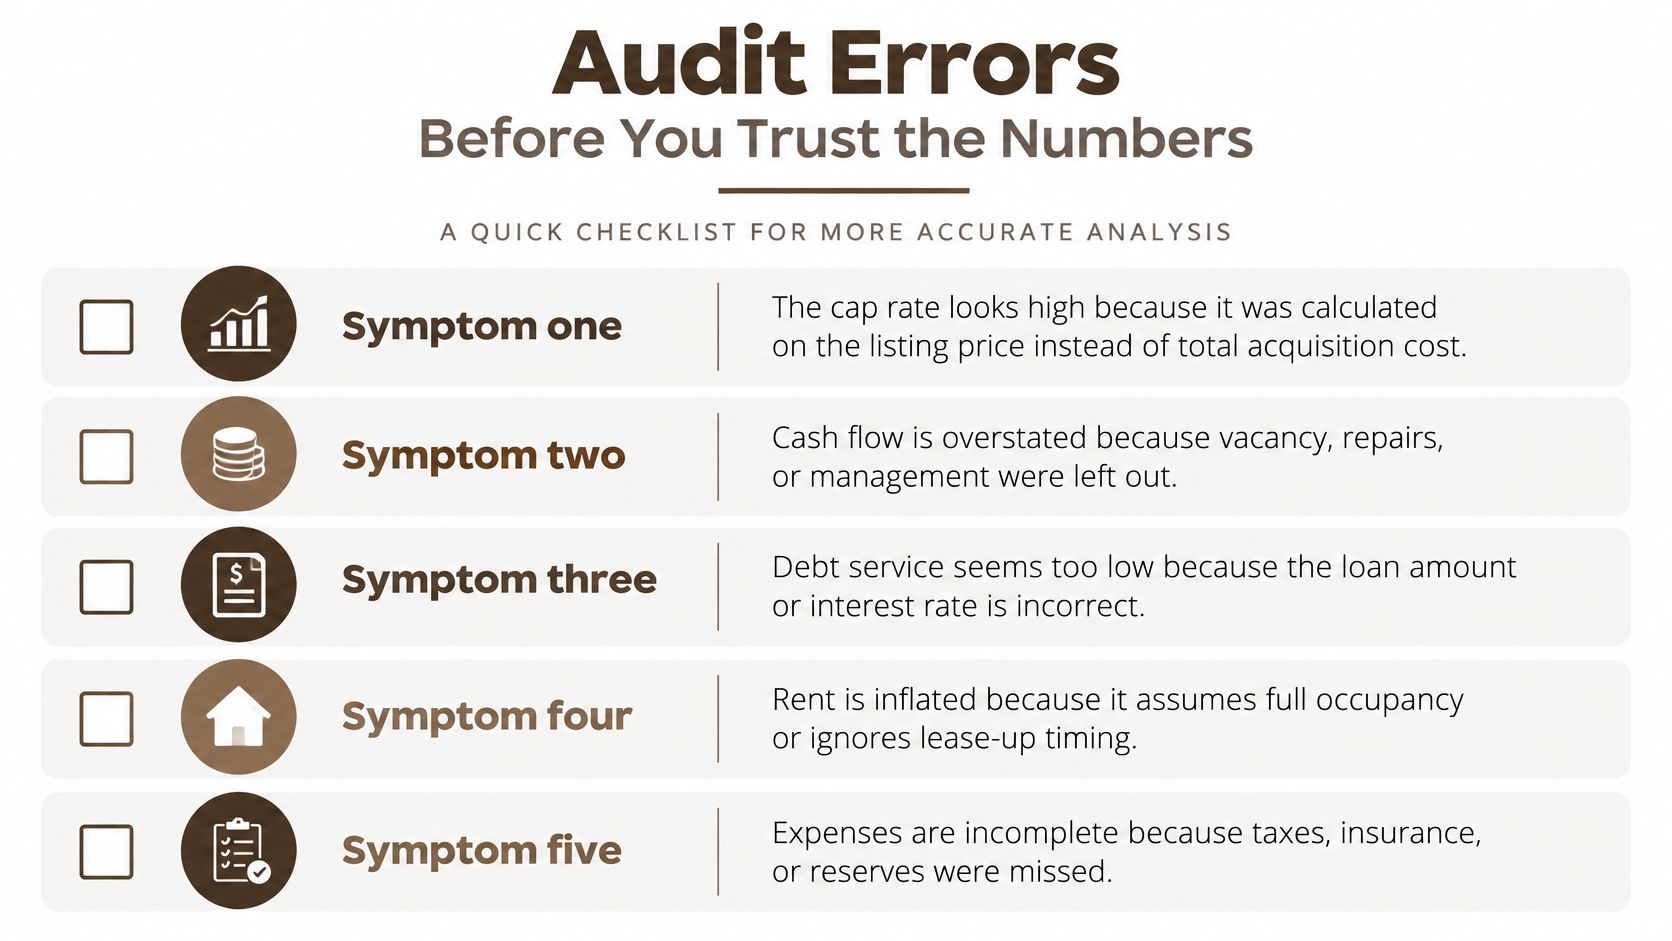
- A cap rate that looks too good. It was probably calculated on the listing price. Divide NOI by price plus closing costs plus renovation instead, and watch the number fall to something believable.
- Operating expenses that look unusually low. Mortgage principal has been entered in the expense block. That understates NOI and counts the loan twice, once as an expense and once as debt service.
- Returns that look suspiciously stable. One occupancy percentage has been copied down every year. Enter a year-by-year rent and vacancy path that follows the actual lease expirations.
- Monthly rows that don't tie to annual totals. Confirm that the twelve monthly rows sum to each annual figure, and that the last monthly closing balance equals the annual ending balance.
- Sources that don't equal uses at purchase. Down payment plus loan plus closing cash should fund price plus closing costs plus reserves exactly. A gap hides a funding shortfall you'll meet at closing.
Change one input at a time, vacancy or the interest rate, and check that each output moves the way you expect and by roughly the amount you expect. An output that doesn't move has a hardcoded value somewhere in its chain. When you need to compare two versions of a model across tabs, spreadsheet data analysis workflows will diff the assumptions faster than scrolling cell by cell.
Confirm the Numbers Before You Make an Offer
Set thresholds before opening the sheet. A minimum coverage ratio under stress, a target cash-on-cash return in the base case, and a rule that severe-case NOI either covers the full loan payment or that you hold enough reserves to bridge the gap for a stated number of months. Write those numbers in a decision block at the top of the workbook, with formulas that flag a fail automatically, so no output gets read without a comparison attached.
If the deal passes the base case and fails the stress case, change the price or the financing. Accepting the optimistic forecast isn't a third option.
Gather the documents that feed the inputs, the current lease, rent comparables, the written insurance quote and the loan estimate, and store them beside the workbook so every number has a source. Then check the inputs against the documents line by line, starting with the rent column against the lease and the insurance line against the quote. Document analysis that accepts PDF, DOCX and XLSX files dropped in together and answers from all of them at once makes that cross-check faster than opening each file to hunt for a figure, and pairing it with automated fact-checking keeps the figures in the workbook tied to the paperwork behind them.
Record the decision, the thresholds and the date. In twelve months the forecast meets reality, and the only way to learn anything from that meeting is to have written down what you expected.
Run the numbers on your next rental in one place. BromeAI reads the lease as a PDF, the rent roll as an XLSX and the insurance quote as a DOCX in the same conversation, then answers across all three so the figures in your workbook trace back to the paperwork. Bring the model and the source documents together and ask which assumption the deal depends on. Visit BromeAI to start.