Spreadsheet Data Analysis: A Step-by-Step Guide
You've opened an export, built a pivot table, and found a number that looks ready for the weekly report. Then someone asks whether cancelled orders are included, why a supplier appears twice, or whether the final month is complete. The chart still looks convincing, but you can't yet defend the answer.
Spreadsheet data analysis means checking the workbook as well as interpreting it. A useful result has a clear definition, traceable inputs, and a calculation someone else can reproduce. That takes more work than formatting a dashboard, but it's the difference between a plausible number and a dependable one.
Table of Contents
- The Seven-Stage Workflow at a Glance
- Preparing Messy Data So It Can Be Analyzed
- Auditing Formulas and Totals Before You Trust Them
- Finding Patterns with Pivots, Trends and Comparisons
- Catching Duplicate and Near-Match Records
- Summarizing Findings Without Overstating Them
- Confirm Your Analysis Is Ready Before You Share It
The Seven-Stage Workflow at a Glance
| Stage | Core action | Evidence to keep |
|---|---|---|
| 1. Preserve the raw import | Save an untouched copy with the source name and export date | Original file and export date |
| 2. Classify fields | Mark labels, IDs, dates, amounts and categories | Field dictionary |
| 3. Validate the data | Check types, blanks, duplicates, ranges and totals against the source | Validation log with counts |
| 4. Audit the formulas | Trace dependencies, compare neighbouring formulas and recalculate samples | Exception list with dispositions |
| 5. Find patterns | Pivot, trend and compare segments | Saved pivot or chart with its filters noted |
| 6. Reproduce key figures | Recalculate headline numbers outside the workbook | Independent figure and the difference from the workbook |
| 7. Summarize with evidence | Separate observed facts from inferences | Summary linked to source rows |
The order protects your conclusions. If you build a pivot before validating categories, inconsistent supplier names become separate groups. If you write the executive summary before reproducing the headline figures, you turn an unchecked calculation into a confident business recommendation. A Global Association of Risk Professionals review reported that 88% of spreadsheets contain errors, citing spreadsheet-risk research. Treat that finding as a reason to check the tool, not abandon it. The practical response is to keep evidence while you work, rather than trying to reconstruct your decisions after someone challenges the result.
Scale the effort to the decision. A small sheet of a few hundred rows used for an exploratory question may need only a quick pass through the opening preparation stages before you investigate further. A workbook feeding a budget or an invoice payment run needs the complete workflow with written evidence. Keep the field dictionary and validation log simple enough that you'll maintain them, but specific enough that another analyst can distinguish an intentional exclusion from an accidental deletion. Pick the stage you most often skip and run it on the next file you open.
Preparing Messy Data So It Can Be Analyzed
Clean data has consistent meaning, not just consistent formatting. A currency symbol doesn't prove a cell contains a number, and a neatly formatted date can still represent the wrong day. The U.S. Department of Education's error-checking guidance identifies sorting mistakes, extraction errors, accidental deletion or duplication, and unchecked outliers as recurring problems.
Build a consistent working table
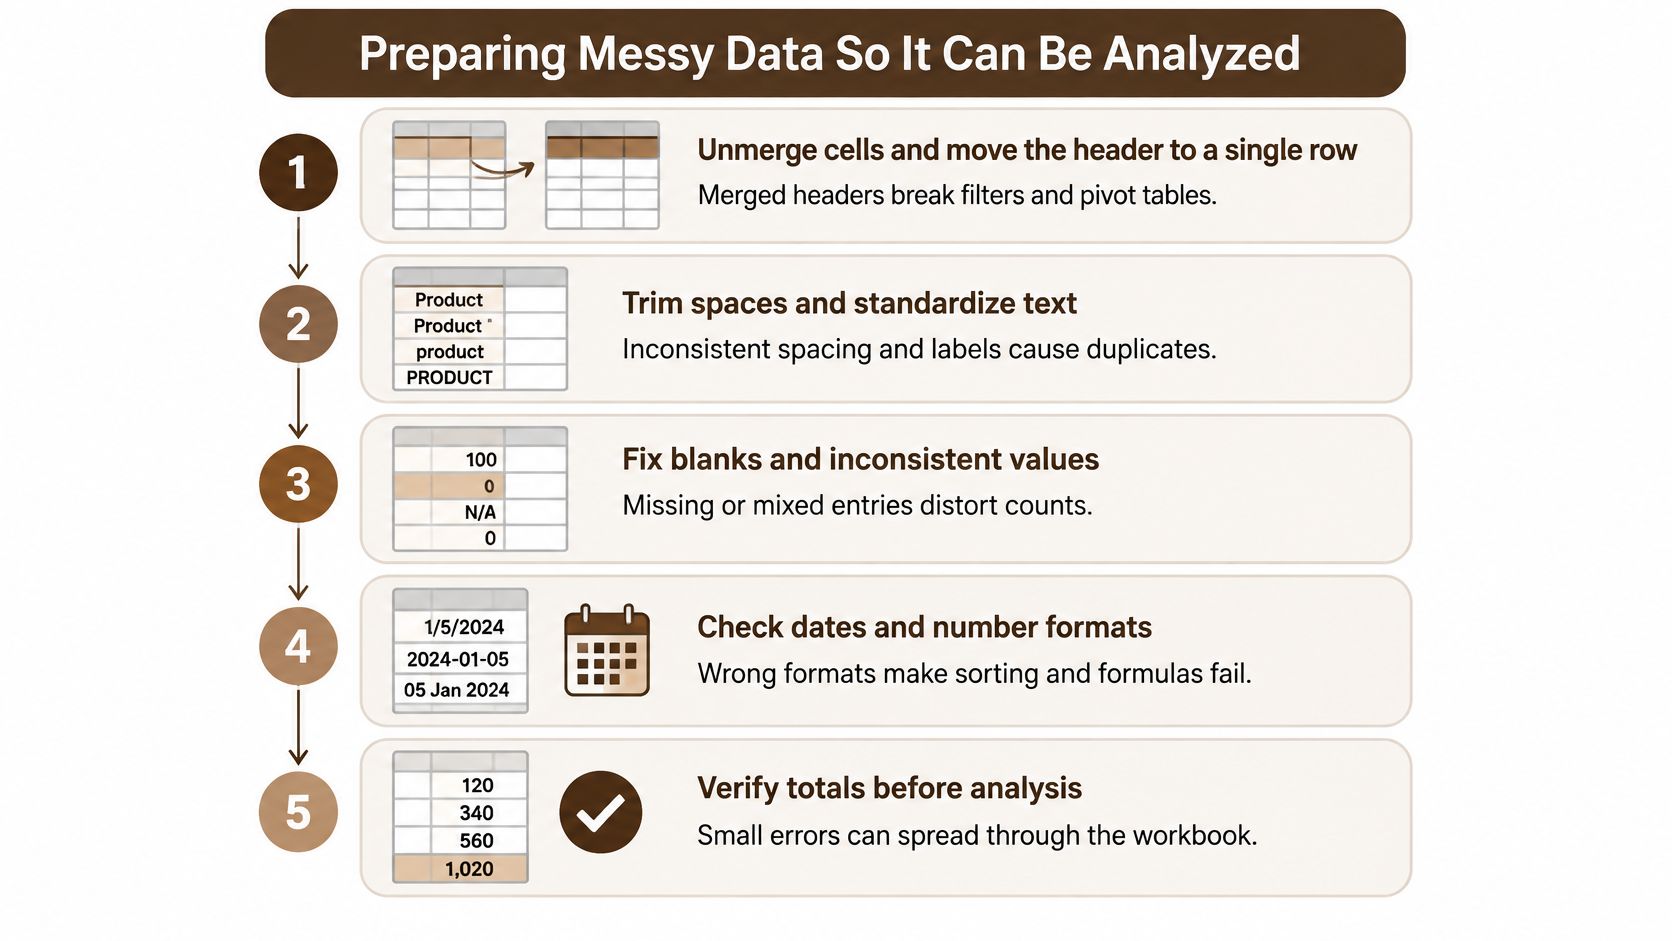
Repair the layout. Merged cells make filtering and pivot construction unreliable. Unmerge them, move headings into a single row, and give each column a unique name.
Leading spaces and inconsistent labels split otherwise identical categories. Apply
TRIMin a helper column, then standardize spellings against a short lookup list, so North and North followed by a space don't remain separate groups.Convert types deliberately. Choose a date interpretation and numeric conversion rule for each column, keeping identifiers as text when leading zeros matter. Count the cells changed and inspect conversion failures rather than overwriting them without notice.
A blank might mean unknown, not applicable, or not yet recorded. Decide which meaning applies before calculating, and keep missing values distinguishable from genuine zeroes so you don't depress averages accidentally.
Flag unusual values instead of deleting them. Use a helper column to mark records for investigation. Preserve enough information to compare results with and without those records.
Sorting a detached column separates values from their original records. Sort the full table by your chosen key, or sort a standalone key list only when it has no linked fields.
Spot-check ten random rows against the raw export and record how many match. Save the sampled record IDs so another person can repeat the check, including dates, amounts, and category assignments.
Sign off on the preparation
Your prepared row count should equal the raw count minus deliberately removed rows. Record every removal with its reason and retain the excluded records separately, especially when the reason involves a judgement rather than a definite import error.
When values originate in invoices or reports, review the extraction process as well as the spreadsheet. A document-analysis checklist can help frame questions about source files, but your sign-off should still identify which source records you checked and what changed.
Auditing Formulas and Totals Before You Trust Them
A formula can calculate successfully and still answer the wrong question. A spreadsheet-error literature review found errors in 94% of the 88 spreadsheets reviewed. The useful response isn't to inspect every cell equally, but to start with the outputs that could change a decision.
Follow the calculation chain
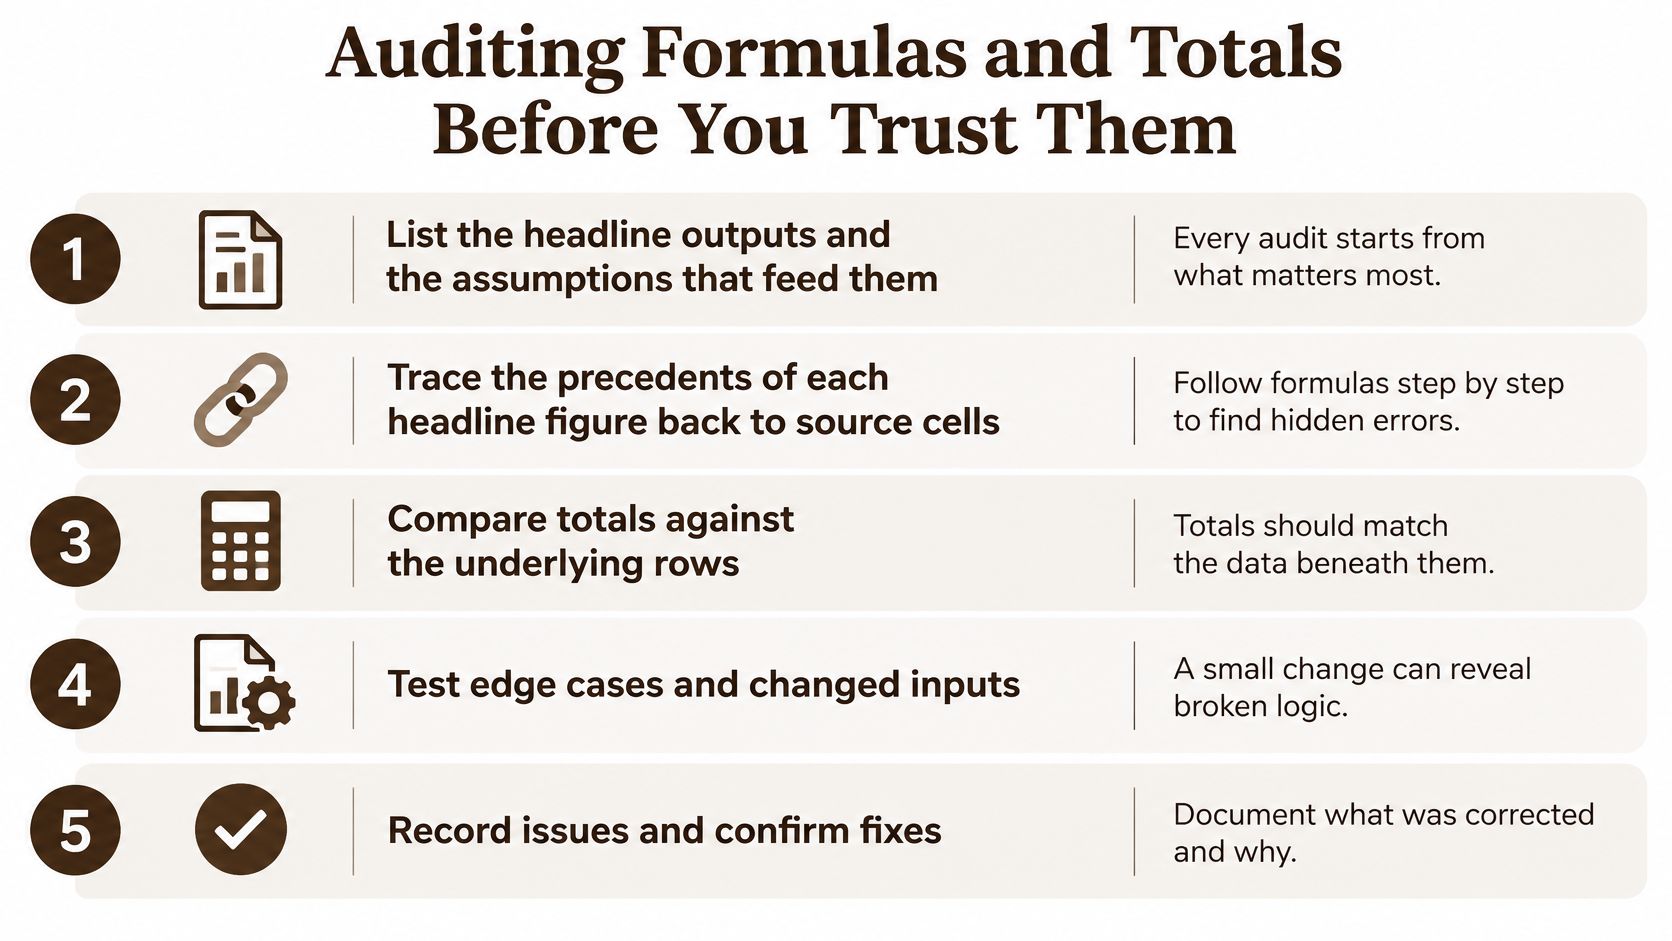
List the headline outputs and assumptions. Identify the figures readers will act on and the inputs that influence them. A budget forecast deserves checks on timing and assumptions, not just addition.
Trace each headline figure's precedents back to input cells. Confirm the references belong to the intended period and dataset, with nothing pointing to an empty or unrelated area.
Recalculate two or three sample rows by hand or in a fresh tab. Include an ordinary record and an edge case, such as a credit note or missing input, rather than selecting only easy examples.
Reconcile subtotals to the grand total and the source system's control total. Record every gap, including a gap explained by a deliberate filter.
Check pivots and charts independently. Use a separate
SUMIFScalculation or a query on the raw export. Copying the pivot's answer into another cell doesn't create an independent check.Log each exception as fixed, explained, or accepted with a reason. Retest affected outputs after a correction and identify who approved any accepted exception.
For transaction-based models, the MyOfficeOps guide to use Excel for small business bookkeeping provides useful bookkeeping context. Keep the distinction clear, though, organizing entries and proving a calculation correct are separate jobs.
Scan for hidden formula faults
| Error | What it looks like | Check |
|---|---|---|
| Hard-coded number | A constant typed inside a formula block | Trace precedents and replace it with a labelled input cell |
| Inconsistent formula | One row differs from the rows above and below it | Compare each formula with its neighbours in a single pass |
| Broken or shifted reference | A relative reference points at the wrong row after a copy | Inspect the references in two sample rows after each paste |
| Truncated range | A SUM stops one row before the last data row | Compare the range end with the last populated row |
| Out-of-date named range | A formula reads an old area after rows are inserted | Check the refers-to address of each named range |
| Hidden rows or columns | Totals skip rows that cannot be seen | Unhide everything and compare the counted rows with the raw export |
| Approximate lookup on an unsorted key | A lookup returns the wrong match | Use exact match or sort the key before using approximate match |
Hidden rows don't automatically fall outside every total. Inspect whether the actual formula includes them, particularly when SUM and SUBTOTAL appear together.
Acceptance rule: Set the threshold before testing, such as zero unexplained differences in critical cells. Don't choose a convenient percentage after seeing the exceptions.
Finding Patterns with Pivots, Trends and Comparisons
| Question | Method | Check before trusting it |
|---|---|---|
| Which segment drives the total? | Pivot table with the segment in rows and the value summed | Pivot grand total equals the SUM of the source column |
| Is the metric rising or falling? | Month-over-month change with a three-month rolling average | Every period covers the same complete date range |
| Do two groups really differ? | Average or median per group with the count of each group | Group sizes are shown beside each average |
| Which records are unusual? | Interquartile-range flags in a helper column | Flagged rows are checked against the raw records |
| Do two variables move together? | CORREL on paired columns, then a scatter chart | The result is described as a relationship, not a cause |
| Did a change cause the shift? | Before and after periods compared with identical filters | Check for other events in the same window before attributing the shift |
Name the question before choosing the chart. For segment analysis, put the segment in pivot rows and the relevant amount in values, then display each segment's share of the whole alongside its total. A large total means something different when the segment also contains most of the records.
Check comparability before interpreting movement
Two checks catch particularly misleading patterns, complete periods and visible denominators. Exclude an incomplete final month from a monthly trend, or explicitly compare equivalent elapsed periods. Otherwise, a partial export can look like a business collapse.
When comparing groups, show the count beside each average or median. In a hypothetical comparison, an average based on twelve records shouldn't receive the same weight as one based on two thousand. Also inspect whether the groups contain comparable products, customers, or transaction types.
For unusual records, a practical screening rule is to flag values below the lower quartile minus 1.5 times the interquartile range, or above the upper quartile plus that amount. This is a review rule, not proof of error. Check the original record before deciding whether the value belongs in the analysis.
A before-and-after difference describes a change. It doesn't, by itself, establish what caused it.
Use identical filters across periods and list other events in the same window. For paired variables, inspect a scatter chart alongside CORREL, and describe the result as a relationship.
If recurring refreshes and shared dashboards become awkward to manage in a workbook, compare BI platforms with Statlyst. A different reporting tool won't resolve an undefined metric. Write each finding with a claim, its calculated value, and its scope, including segment, date range, and source.
Catching Duplicate and Near-Match Records
Duplicate transactions don't always arrive as identical rows. Someone may add a suffix to an invoice number, abbreviate a supplier name, or re-enter an amount differently. In Trustmi's enterprise-payment analysis published by Morningstar, 61% of paid-twice cases used invoice numbers that weren't identical.
Build candidates without deleting evidence
Create a normalized key. Combine the vendor name in lowercase with punctuation removed, the amount rounded to the cent, and the invoice date. Preserve the original fields beside the normalized versions, and keep currencies separate.
Run an exact match on that key first. Use
COUNTIFSor a grouped query to flag repeated combinations, but don't treat the flag as a deletion instruction.Broaden the search deliberately. As an initial review setting, try a 30-day date window and a 0.5 percent amount tolerance. These are adjustable screening parameters, not universal accounting rules, and they need tightening or widening to suit the payment process.
Score candidate pairs by agreement on vendor, amount, date, and invoice details. Sort by score so reviewers examine the strongest candidates first, and record how each field contributes.
Review the top band against original documents. Mark each pair as duplicate, legitimate repeat, or unclear. Recurring rent and scheduled instalments can resemble duplicate payments without being mistakes.
Total confirmed duplicate value separately from amounts still awaiting payment. Distinguish money already paid twice from a duplicate invoice that can still be stopped, and avoid counting the same transaction repeatedly across overlapping candidate pairs.
Make the payment status explicit
A duplicate-invoice list isn't a payment reconciliation. Match candidates to payment records before describing money as recoverable or preventable, and check whether credits or reversals have already resolved the issue. Nexist's guide to bank reconciliation for Australian SME owners provides useful context for connecting ledger entries with bank activity.
Helper columns can calculate similarity scores, but they can't decide whether two invoices represent the same obligation. Keep the matching thresholds, candidate pairs, supporting documents, and review decisions in the audit log. A person should make the final call on every flagged pair, including those left unresolved.
Summarizing Findings Without Overstating Them
Every headline number should carry its source rows and a note on confidence.
A useful executive note makes the result easy to challenge constructively. The reader should be able to identify what you found, where it came from, and what could change the conclusion without opening every worksheet.
Write a finding that can be tested
Consider a hypothetical returns review covering the North and West regions. Instead of declaring that a new delivery process caused more returns, structure the note like this:
- Finding: The observed return rate rose in the latest complete month across North and West.
- Number and scope: Insert the reproduced returned-order count divided by eligible orders for each region and comparison month. Show the order counts beside the rates.
- Evidence: Identify the order export, export date, worksheet, and included record IDs, together with the return-status definition.
- Observation versus inference: The increase is observed. A possible connection to the delivery change remains an inference until other explanations are checked.
- What would change the conclusion: Late return-status updates or a change in the eligible-order definition could alter the comparison.
The note contains a finding without inventing a causal story. Populate its numerical fields only after reproducing them, rather than adding illustrative figures that someone might mistake for actual results.
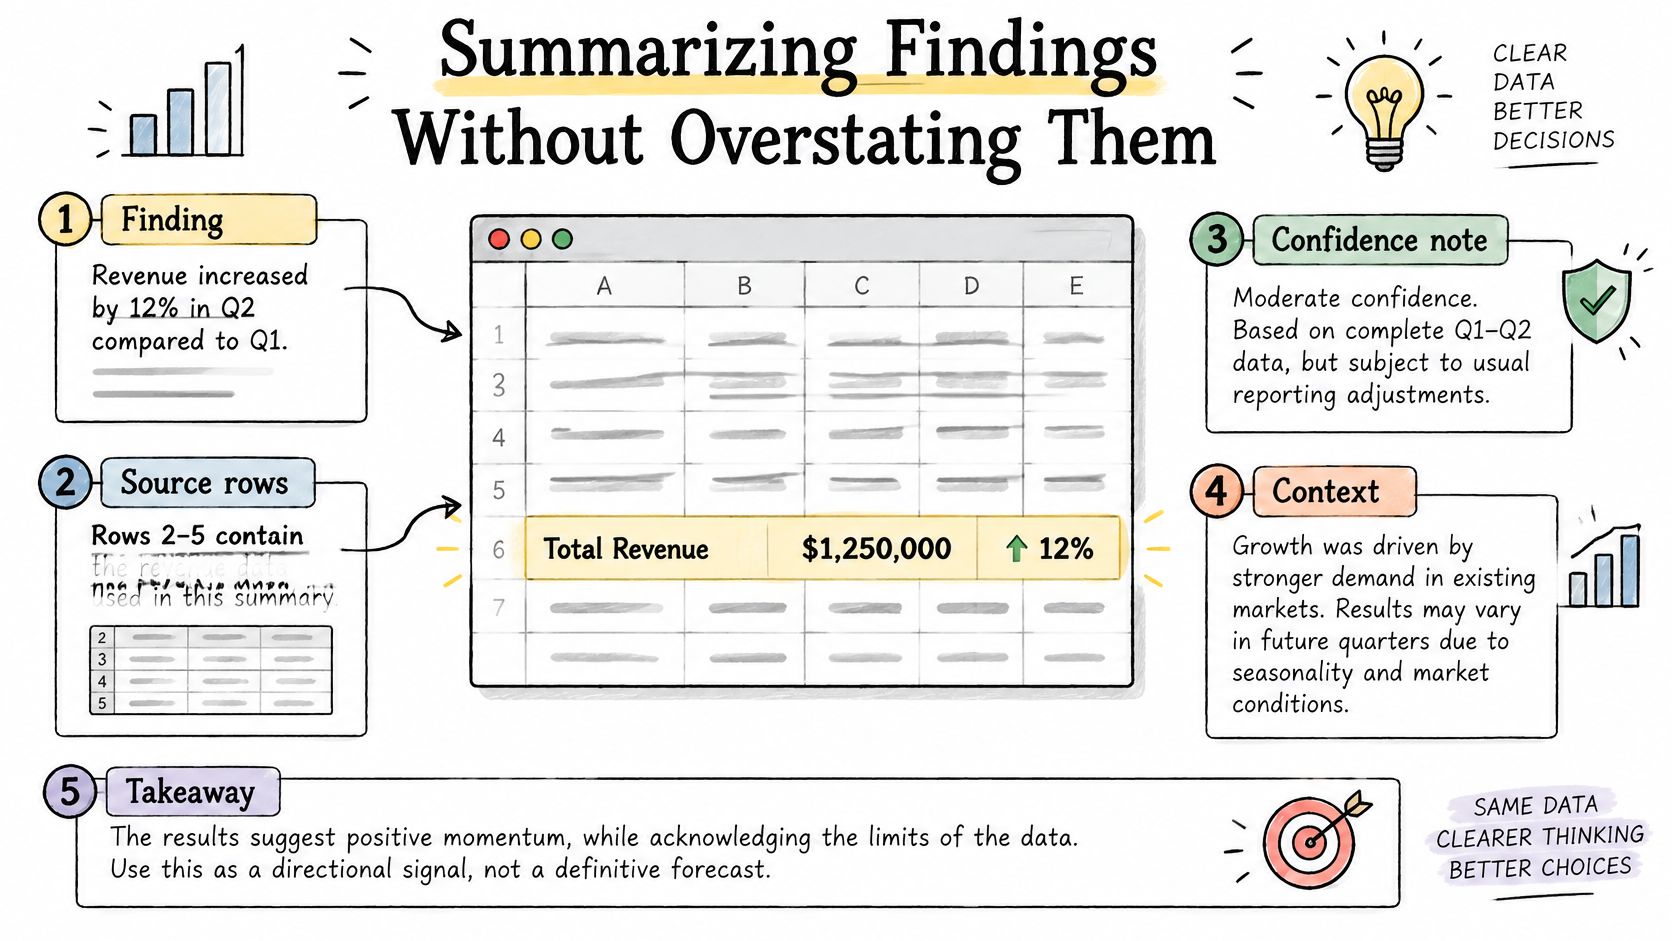
Before drafting, ask what would prove this result wrong? Check that possibility first, whether it's a changed denominator, an omitted export, or a delayed status update. Explain uncertainty in terms of its decision impact, not with a vague warning that results may vary.
For document-heavy investigations, the questions outlined for research and source-analysis work can help organize supporting material. Keep the numerical evidence separate from explanatory commentary so reviewers can assess each on its merits.
If an AI tool drafts the summary, compare every number with your reproduced figures before sharing it. Fluent wording doesn't establish accuracy. Send the executive note with the audit log, the reproduced figures, and the assumptions list.
Confirm Your Analysis Is Ready Before You Share It
Use a short readiness test before sending the workbook:
- Raw evidence preserved: The untouched import remains available.
- Exceptions documented: The audit log gives every issue a disposition.
- Headline figures reproduced: Independent calculations support the reported values.
- Claims qualified: The summary distinguishes facts from inferences.
If an item fails, return to the stage responsible for it before sharing. A deadline doesn't make an unexplained difference acceptable.
When your analysis depends on invoices, contracts, or reports, put the XLSX file together with the related PDF and DOCX files in one BromeAI conversation. Our AI workspace can answer across those files together, with answer elements tied to their originating files. For multi-step checks, describe the intended outcome and inspect the Agentic AI task list before anything runs, then review the sources reported as each task finishes.
Keep independent reproduction as your own sign-off check. The assistant can accelerate investigation, but you remain responsible for approving the numbers.
BromeAI offers combined spreadsheet and document analysis, so you can question an XLSX export alongside the invoices and reports behind it. Visit BromeAI with a working copy of your workbook and its supporting files, then ask for a source-backed review of a headline figure before expanding the analysis.