How to Do Spreadsheet Stock Analysis Step by Step
You open a stock workbook you built last quarter. The dashboard says the shares are worth $186.40, and that number is why the position is sized the way it is. Then three things catch your eye. The diluted share count hasn't moved since a buyback eight months ago, the closing price was pasted from a screen before the last earnings release, and a revenue growth rate sits typed inside a formula instead of in an assumptions tab.
None of those mistakes triggers an error warning. Together they shift the price target by double digits. Spreadsheet stock analysis fails in this way, through a chain of linked cells where one stale input persists through every recalculation. The fix isn't a cleverer formula. It's a workbook structure and an audit sequence that catch the stale input before you act on the output.
Table of Contents
- Set Up Your Workbook Before the First Formula
- How to Import and Clean Price Data Step by Step
- Core Metrics and the Formulas Behind Them
- Reading Metrics in Context Without Overreacting
- Chart Trends and Build a Simple Dashboard
- Audit the Workbook Before Trusting Any Price Target
- Confirm Your Model Against One Filing This Week
Set Up Your Workbook Before the First Formula
Typing a share price straight into a formula is the defect I find most often in stock workbooks. The cell calculates, the target lands on something that looks reasonable, and six months later nobody can say whether that price came from a filing, a data feed, or a headline someone read once. The value has no provenance, so it can't be defended, refreshed, or corrected.
Separate tabs fix that. Five of them, built before the first formula, carry the whole analysis:
| Tab | What It Holds | Rule to Follow |
|---|---|---|
| Inputs | Raw prices, financial statement lines, ticker list | Paste values only and never type formulas here |
| Assumptions | Growth rates, margins, discount rate, terminal growth | Every forecast number lives here and nowhere else |
| Calculations | Returns, ratios, valuation outputs | Formulas reference Inputs and Assumptions only |
| Dashboard | Charts and summary cells for each ticker | Read-only links to Calculations |
| Sources | Filing page, data provider and retrieval date for each input block | One row for every input block |
The Assumptions tab carries the most weight. When a colleague argues your terminal growth rate is too generous, the change should be one edit in one cell, not a hunt through forty formulas for a hard-coded 0.025.
Ticker handling deserves its own column. Microsoft's guidance on getting a stock quote in Excel separates identifying a security from retrieving its history: you convert the text to the Stocks data type so formulas can pull price and price change, then use STOCKHISTORY for the dated series. That documentation also accepts an exchange-qualified identifier such as XNAS:MSFT, which is a real control when the same symbol trades on more than one venue and you don't want to discover later that you modeled the wrong listing.
The two-minute test: hand the workbook to a colleague and ask them to trace any dashboard number back to its source. If it takes longer than two minutes, the structure needs work before the analysis means anything.
The habit that makes this stick is the same one behind spreadsheet journaling for inconsistent traders, where a written entry you can reread beats a decision you can't reconstruct. An assumptions tab is that journal for a valuation.
How to Import and Clean Price Data Step by Step
Price history is where imported data goes wrong most often, and the failures are dull. A duplicated Tuesday, a series that stops three weeks before the last earnings date, or dates stored as text that refuse to sort all produce charts that look entirely plausible.
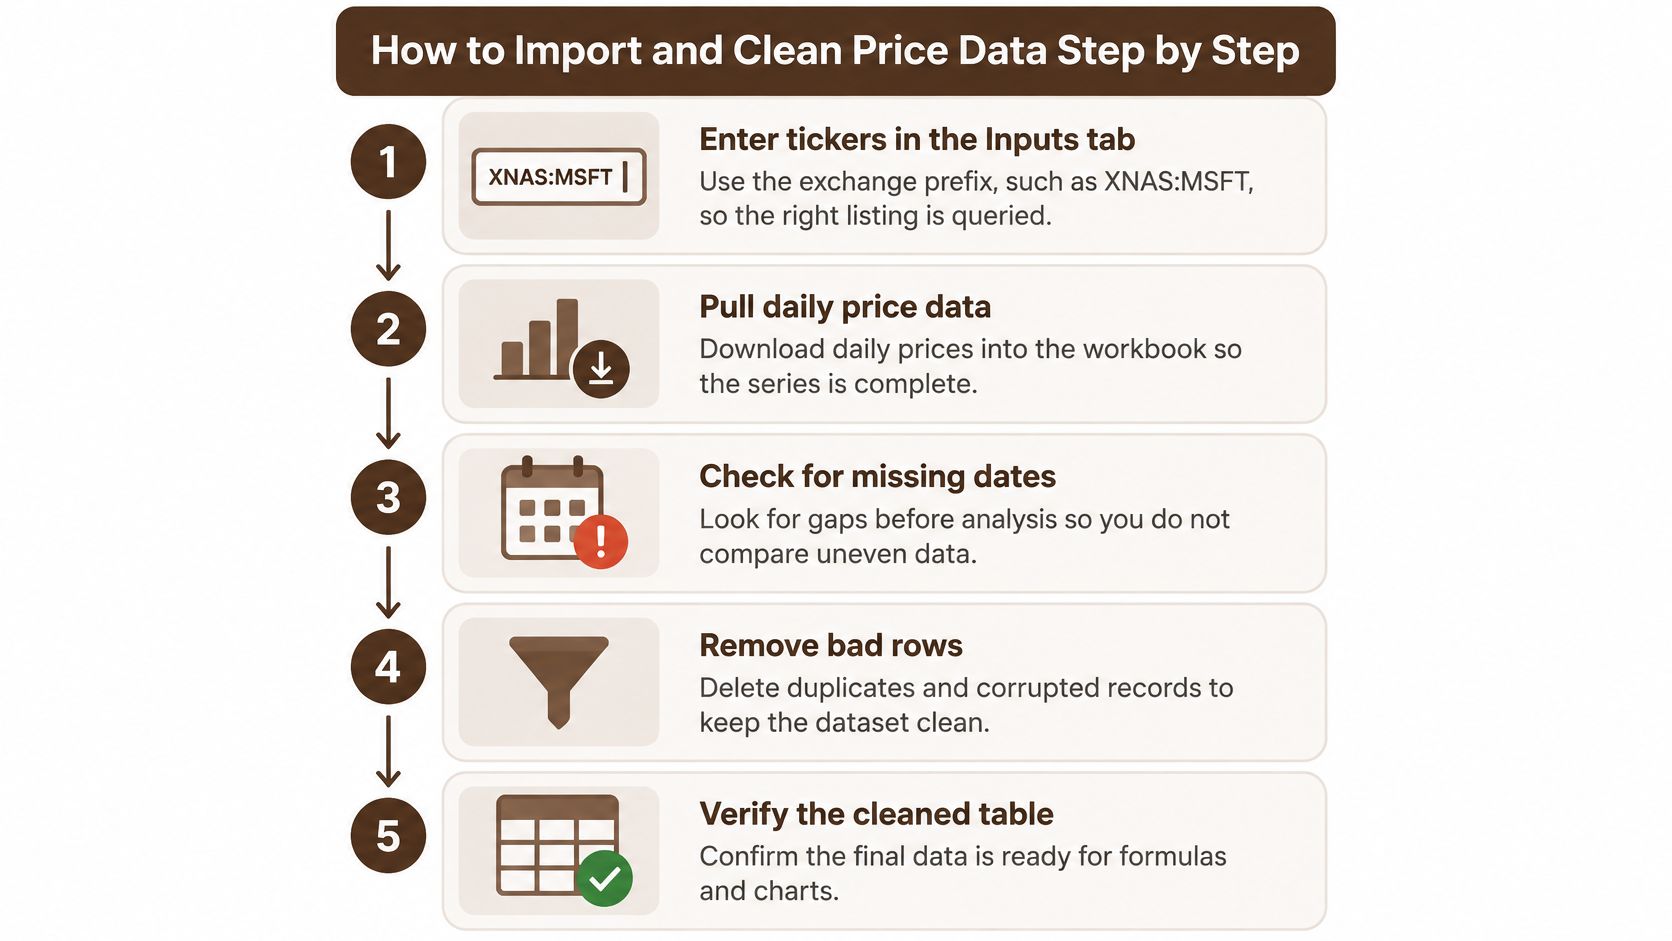
A six-step sequence keeps the series reproducible. Each step exists because skipping it has burned a model somewhere.
- Enter tickers with the exchange prefix. Write XNAS:MSFT, not MSFT, in the Inputs column. The slip here is copying a symbol list from a screener that uses a different venue code, then wondering why the price series stops in 2021.
- Pull the history with one formula. Microsoft's STOCKHISTORY function reference sets the syntax as STOCKHISTORY(stock, start_date, end_date, interval, headers, property), with interval set to 0 for daily, 1 for weekly and 2 for monthly, and fields that include date, close, open, high, low and volume. The common slip is omitting the interval and getting a daily spill where you expected monthly rows.
- Paste the output as values into a dated raw tab. Keep the formula in a separate scratch sheet if you like. A live spill can rewrite history when the provider revises or re-bases its data, and a returns calculation that shifts underneath you is worse than a stale one you can see.
- Confirm the adjustment basis for splits and dividends. Unadjusted prices turn a two-for-one split into what looks like a 50 percent crash. Note in the Sources tab whether the feed is split-adjusted, dividend-adjusted, or neither, because your total return formula depends on which.
- Hunt for missing sessions, duplicate dates and text-formatted dates. Sort ascending, check the row count against the trading calendar for the period, and convert any date column stored as text before it reaches a formula. A single duplicated date double-counts one day of return.
- Record the retrieval date and the provider against each input block. Six months from now, "close price, column F" tells you nothing about whether the figure predates a restatement.
Data preparation is where the hours disappear. A 2025 Alteryx survey of 1,400 AI-using data professionals found that 76% still relied on spreadsheets as their primary data-preparation tool, and 45% spent more than six hours a week on cleansing and preparation.
Finish with a sanity check that costs thirty seconds. The first and last closing prices in your cleaned tab should match the provider's own chart for the same dates. If they don't, the fault is in the import, and no amount of formatting on the dashboard will fix it. The workflow of keeping raw inputs separate from calculations is the same principle covered in this guide to spreadsheet data analysis for non-financial datasets.
Core Metrics and the Formulas Behind Them
Build the metrics in the order a decision gets made: how the stock behaved, what it's worth, and whether the company survives a bad year. That order matters because a valuation multiple on a company that can't cover its interest is a number without a future.
| Metric | Formula | What It Tells You |
|---|---|---|
| Total return | (End price - Start price + dividends) / Start price | Gain over the period including income |
| Annualized volatility | Standard deviation of daily returns × square root of 252 | How much the price swings |
| Maximum drawdown | Lowest value divided by prior peak, minus 1 | Worst peak-to-trough loss |
| P/E ratio | Share price / Earnings per share | Price paid for each unit of earnings |
| EV/EBITDA | (Market cap + Net debt) / EBITDA | Valuation that accounts for debt |
| Debt to equity | Total debt / Shareholders' equity | Leverage and financial risk |
| Current ratio | Current assets / Current liabilities | Short-term liquidity |
| Free cash flow yield | Free cash flow / Market cap | Cash return relative to price |
Every formula should reach only into Inputs, Assumptions and Calculations. Total return pulls closes and dividends from Inputs. EV/EBITDA pulls market cap and net debt from Calculations and EBITDA from Inputs. The moment a formula reaches back into a typed number, the audit trail ends at that cell.
Where the Formulas Quietly Go Wrong
- Mixing trailing and forward earnings in one ratio. A P/E built on last year's EPS sitting beside a forward EV/EBITDA produces a comparison that means nothing. Label the basis in the column header.
- Mismatched share count dates. Market cap takes price on one date and diluted shares from another, and the resulting multiple is wrong by whatever the buyback or issuance did in between.
- Annualizing volatility the wrong way. Multiply daily standard deviation by the square root of 252 trading days, not by 252. The second version overstates risk by a factor of about sixteen.
- Averaging ratios across peers. A simple average P/E weights a company with tiny earnings the same as a large one. Aggregate market cap and aggregate earnings, then divide.
Hand-check first: build one metric by hand on a ticker whose numbers you know from the filings, then compare it with a provider's published figure before you copy the formula down two hundred rows.
That habit transfers to other asset classes as well. The inputs, assumptions, calculations and dashboard split is the same structure set out in this spreadsheet rental property analysis walkthrough, because the discipline is about traceability rather than about equities.
Reading Metrics in Context Without Overreacting
A P/E of 30 means almost nothing on its own. Beside a regulated utility trading at 12 it looks expensive. Beside a software company growing revenue at 25 percent a year it looks ordinary. The ratio didn't change. The reference point did.

So put a reference point in the workbook next to every ratio. Two are enough. The company's own five-year range, which tells you whether today's reading is unusual for this business, and two or three direct peers measured on the same date, which tells you whether it's unusual for the industry. Peers on a different date are not a comparison, they're a different market.
A Level Matters Less Than a Trend
A debt to equity ratio of 1.4 tells you less than a ratio that has climbed for four consecutive quarters. The first is a snapshot. The second is a company changing how it funds itself, and that change usually shows up in interest expense and covenant headroom before it shows up in the share price.
Earnings quality needs the same scrutiny. A profit boosted by a one-off asset sale flatters P/E for exactly one year. Adjusted earnings that exclude a cost the company incurs every single year, such as recurring restructuring or stock compensation, do the same thing permanently. Read the reconciliation between reported and adjusted figures in the filing rather than taking the adjusted number from a data feed.
Write the falsifier first. One sentence per metric stating what would change your view. "If gross margin stays below 38 percent for two quarters, the pricing argument is wrong." A conclusion you can't challenge in six months wasn't a conclusion, it was a mood.
Volatility and maximum drawdown describe what already happened. They tell you how the stock behaved in the period you measured, and they say little about what happens to the business next. Use them to size a position, not to forecast a return.
Chart Trends and Build a Simple Dashboard
Every chart should answer the question you opened the workbook to ask. A chart built because it fills space on a dashboard usually gets deleted within a month.
| Question | Chart | Setup Tip |
|---|---|---|
| Where has the price been trading? | Line chart | Plot closing price with the 50-day and 200-day averages on the same axis |
| How deep did the price fall? | Area chart | Plot drawdown from the running peak |
| How jumpy has the stock been? | Line chart | Plot 30-day rolling volatility |
| Which company is cheaper? | Bar chart | Compare P/E or EV/EBITDA on the same date |
| Is valuation supported by growth? | Scatter chart | Plot P/E against revenue growth, one point per ticker |
A line chart of closing prices with the 50-day and 200-day moving averages shows direction and whether the price sits above or below its trend. Read the crossover carefully, since a 50-day line dropping below the 200-day line describes the last few months of trading, not the next one.
The drawdown area chart is the most honest picture of risk on the whole page. It shows how deep a decline went and how long the recovery took, which a single volatility number can't communicate.
One Set of Charts for Every Ticker
Build a ticker dropdown in a single cell and drive every chart through lookup formulas such as INDEX and MATCH or XLOOKUP against that cell. One set of charts then serves every company in the list, and you can flip between two peers in a second instead of maintaining a dozen separate dashboard tabs. Free template options, including the Excel stock tracking workbook choices gathered by Finzer, show how far a simple linked table can go before you need anything custom.
Fix the axis on comparisons: lock the y-axis scale when you put two tickers side by side, because an auto-scaled chart makes a 5 percent move look identical to a 40 percent one.
Audit the Workbook Before Trusting Any Price Target
A price target is the last cell in a queue. Change the diluted share count in Inputs and market cap moves, enterprise value moves, EV/EBITDA moves and the per-share value moves behind it. Miss a stock split in the price history and every return, volatility and drawdown figure built on that series bends the same way. One stale input reaches the output through every cell between them.
A 2021 systematic review presented to the UK Parliament put financial-modeling error rates close to software-writing error rates, at roughly one error in every 20 operations, and reported that 59% of formulas containing errors had at least one dependent cell, with an average of 9.6 dependent formulas per erroneous cell. Measured formula-error rates run around 0.8% to 1.8% of formula cells, which sounds tolerable until you count the cells feeding a valuation output. Under stronger audit procedures, one synthesis of spreadsheet error research found important errors in 91% of 55 spreadsheets examined.
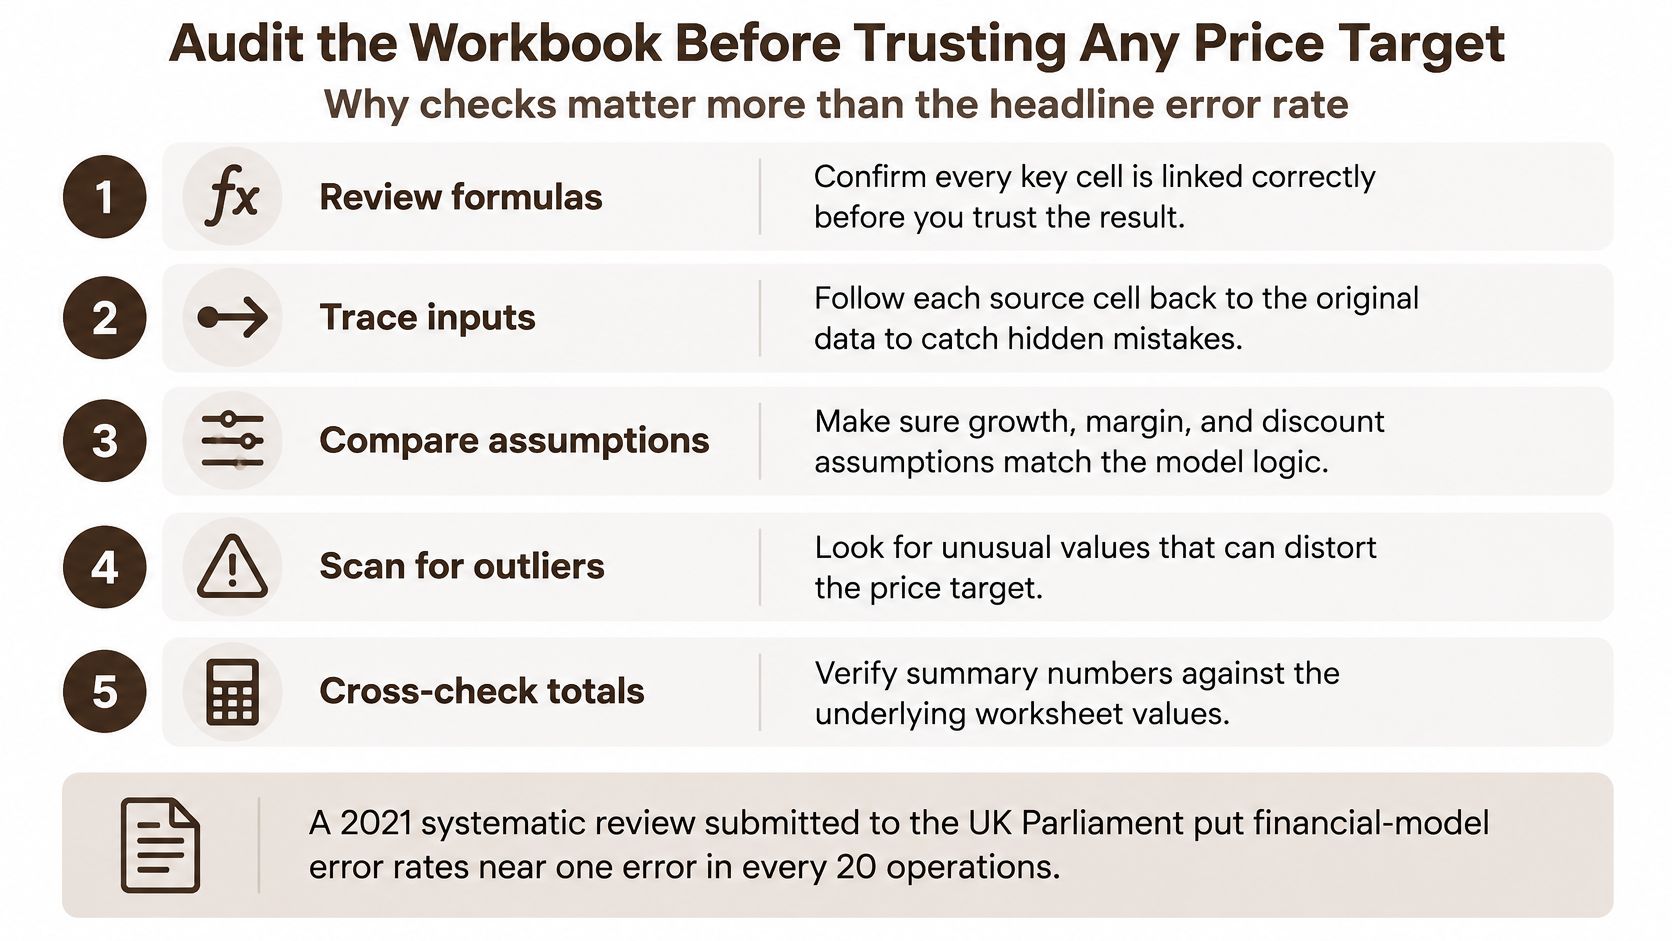
Order the checks by how far an error can travel downstream:
- Trace the price target backwards. Walk from the per-share value through equity value, enterprise value, EBITDA, revenue and the price inputs, opening every cell in the chain. A stale share count or an unadjusted split usually sits near the start of that chain, which is exactly why it reaches the target at the end.
- Reconcile the statements. Match revenue, net income and diluted shares to the filing page recorded in Sources, and treat any difference as an error until proven otherwise.
- Recalculate independently. Build enterprise value and per-share value a second time in a fresh tab, without referencing the original formulas.
- Run three cases. Pessimistic, base and optimistic, with the assumptions changed only in the Assumptions tab, so you can see how far the target moves.
- Test the signal. For any trading rule, define it before looking at results, separate training from test periods, include transaction costs, and report drawdown and risk-adjusted return alongside hit rate.
- Validate the ingestion layer. The data-checking methods in Scrappey's data validation guide apply directly to price and filing imports, from range checks to duplicate detection.
An AI pass works well as a second reader. Point it at the workbook and the filing together, as described in this guide to using AI for data analysis, and ask it which cells changed after an earnings release or which inputs carry no recorded source.
Then apply the rule that closes the audit. Because errors multiply through dependent cells, the acceptance standard is zero unexplained reconciliation differences: every gap between the workbook and the filing gets a written explanation, however small, before the target goes anywhere near a decision.
Confirm Your Model Against One Filing This Week
Take one ticker and build the five tabs in a copy of the workbook. Import one year of daily prices using the steps above, then calculate total return, annualized volatility, maximum drawdown and EV/EBITDA for that year. Pull revenue, net income and diluted shares for the same period from the annual filing into Inputs, and write the filing page and retrieval date into Sources.
Now compare. Every difference between your figure and the filing gets written down, however small, and resolved before you move on. A diluted share count that's off by two percent is a two percent error in market cap, in EV/EBITDA and in the per-share value, and it will follow you into every scenario.
Write the thesis in two sentences. "Revenue growth above 10 percent will expand EBITDA enough to push EV/EBITDA below its five-year average." Then name the single metric that would prove it wrong and the threshold that triggers it, for example EBITDA margin below 18 percent for two quarters.
Then hand the workbook to a second reader and ask them to rebuild one output using only Inputs and Assumptions. Record every question they ask, because each one points at a step the workbook doesn't explain on its own. If you'd rather start from documents than from a blank file, our document analysis accepts PDF, DOCX and XLSX files dropped in together and answers from all of them at once, which is enough to put the filing, the broker note and the workbook in front of one reader.
The workbook is only as trustworthy as the audit you ran on it, and BromeAI gives you a second reader that can look at the filing, the research note and the XLSX model inside a single case instead of three browser tabs. Upload the annual report as a PDF alongside your workbook and ask which line items disagree, which cells changed after the earnings release, and which assumptions have no source recorded. Visit BromeAI to run that review on your own model this week.